National Data Analytics Platform (NDAP)
Unlocking public data for smarter decisions
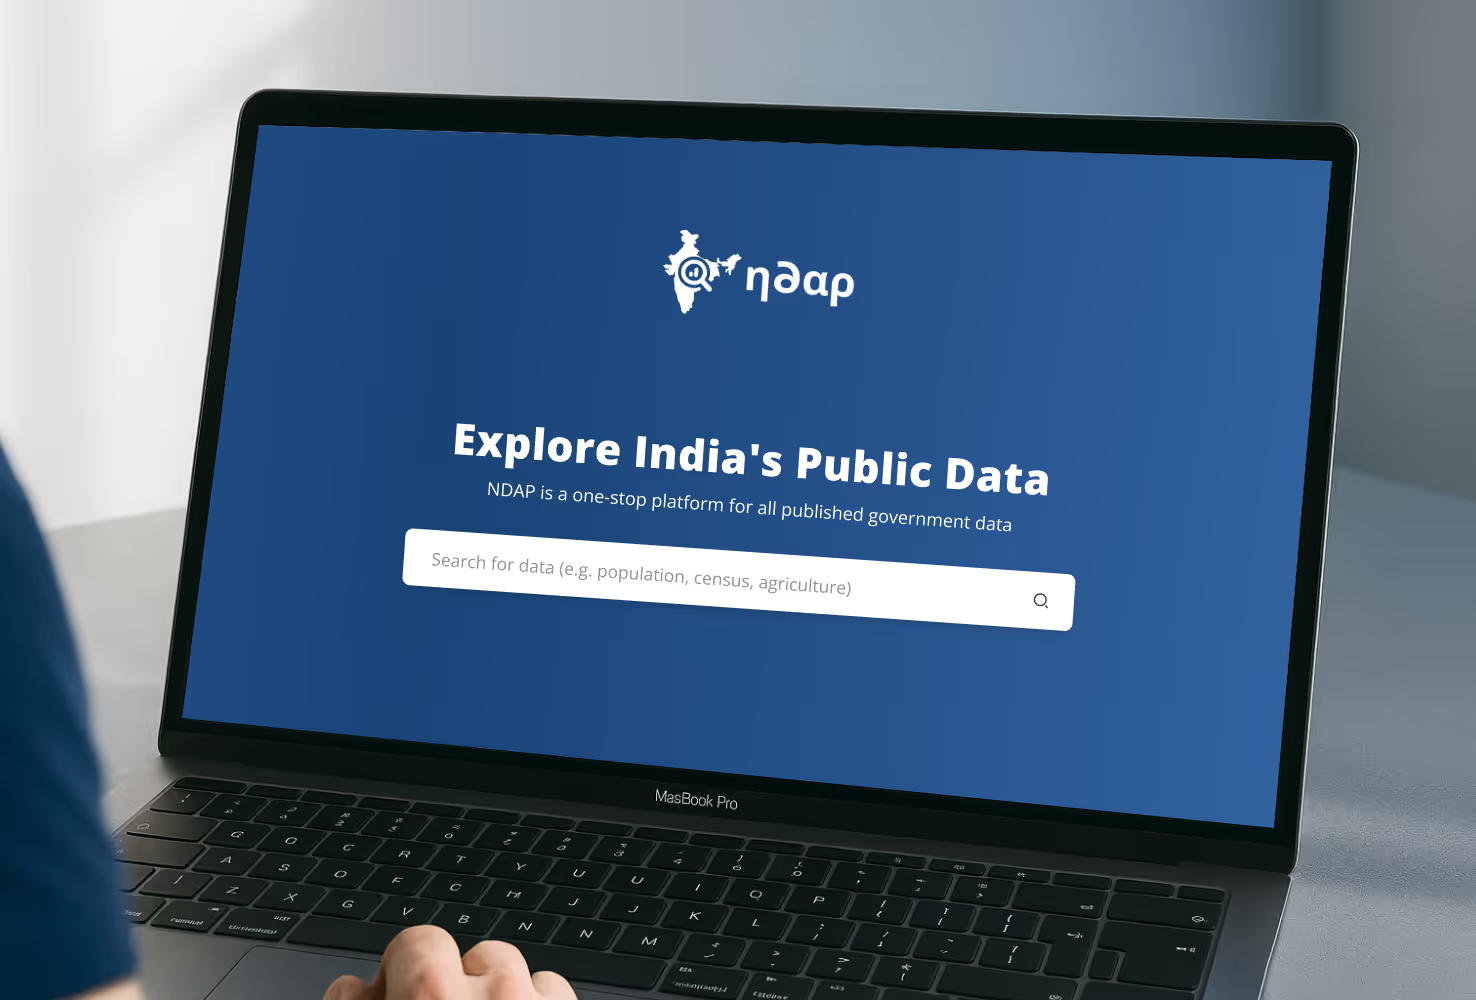
NDAP is a digital platform created to make India’s public government data easier to access, explore, and use. It brings together high-quality datasets from across sectors in one place, with tools for search, visualisation, and analysis.
- Industry
- Government Tech
- Stage
- Digital Public Infrastructure
- Deliverables
- User Research, Curation Workshop, Design Strategy, Prototyping, Usability Testing, Interface Design
The vision
The platform was launched by the Indian Government’s Public Policy entity NITI Aayog, in 2022, with the aim to foster a culture of transparency, accountability, and evidence-based decision making. Its goal is to make high-quality government data a powerful tool for policymakers, researchers, and citizens alike.

The challenge
While there is a lot of public data in India, it was scattered across sectors, departments, and states. This posed a challenge to bring it all together on a single platform.
Once that was done, the next goal was to tackle challenges with usability. For the tool to be truly usable, the platform should allow users to search, merge two datasets, analyse, and visualise data, among other things. However, most public data in India is siloed, not user-friendly, and not standardised. Data quality was also a concern.
The solution
Our team first worked on building the MVP – in this case, a platform that brought all the data sources together. Once this platform was live, and after usage behaviour data highlighted the gaps and challenges, we set out to make it more effective.
We focused on creating intuitive flows that would allow users to effectively search, efficiently merge two datasets, and create quick visualisations by adding filters and desired configurations.
Bringing the right data to the fore
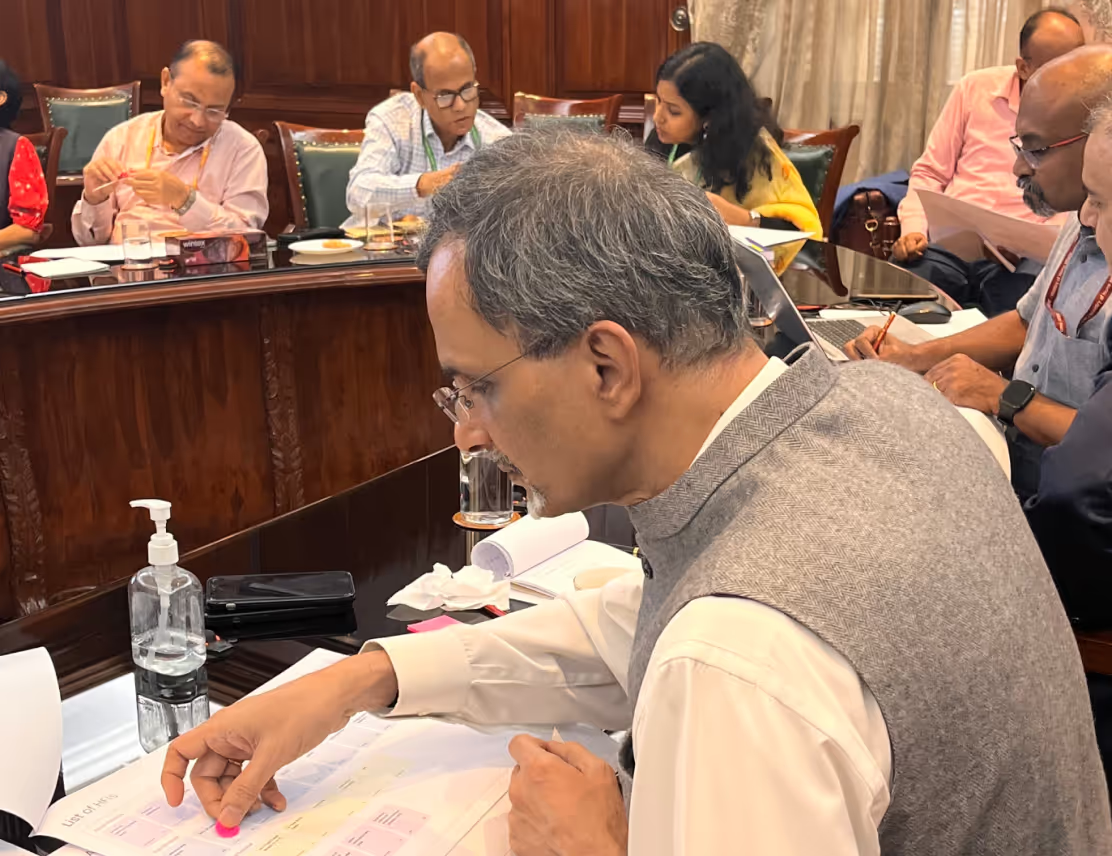
The primary challenge to tackle was data curation: bringing relevant and accurate data on the platform that is most helpful for research and policymaking. We held community workshops with experts from the Government and civil society organisations to surface the right data sources, and curate the most telling indicators.

Easier to find, easier to use
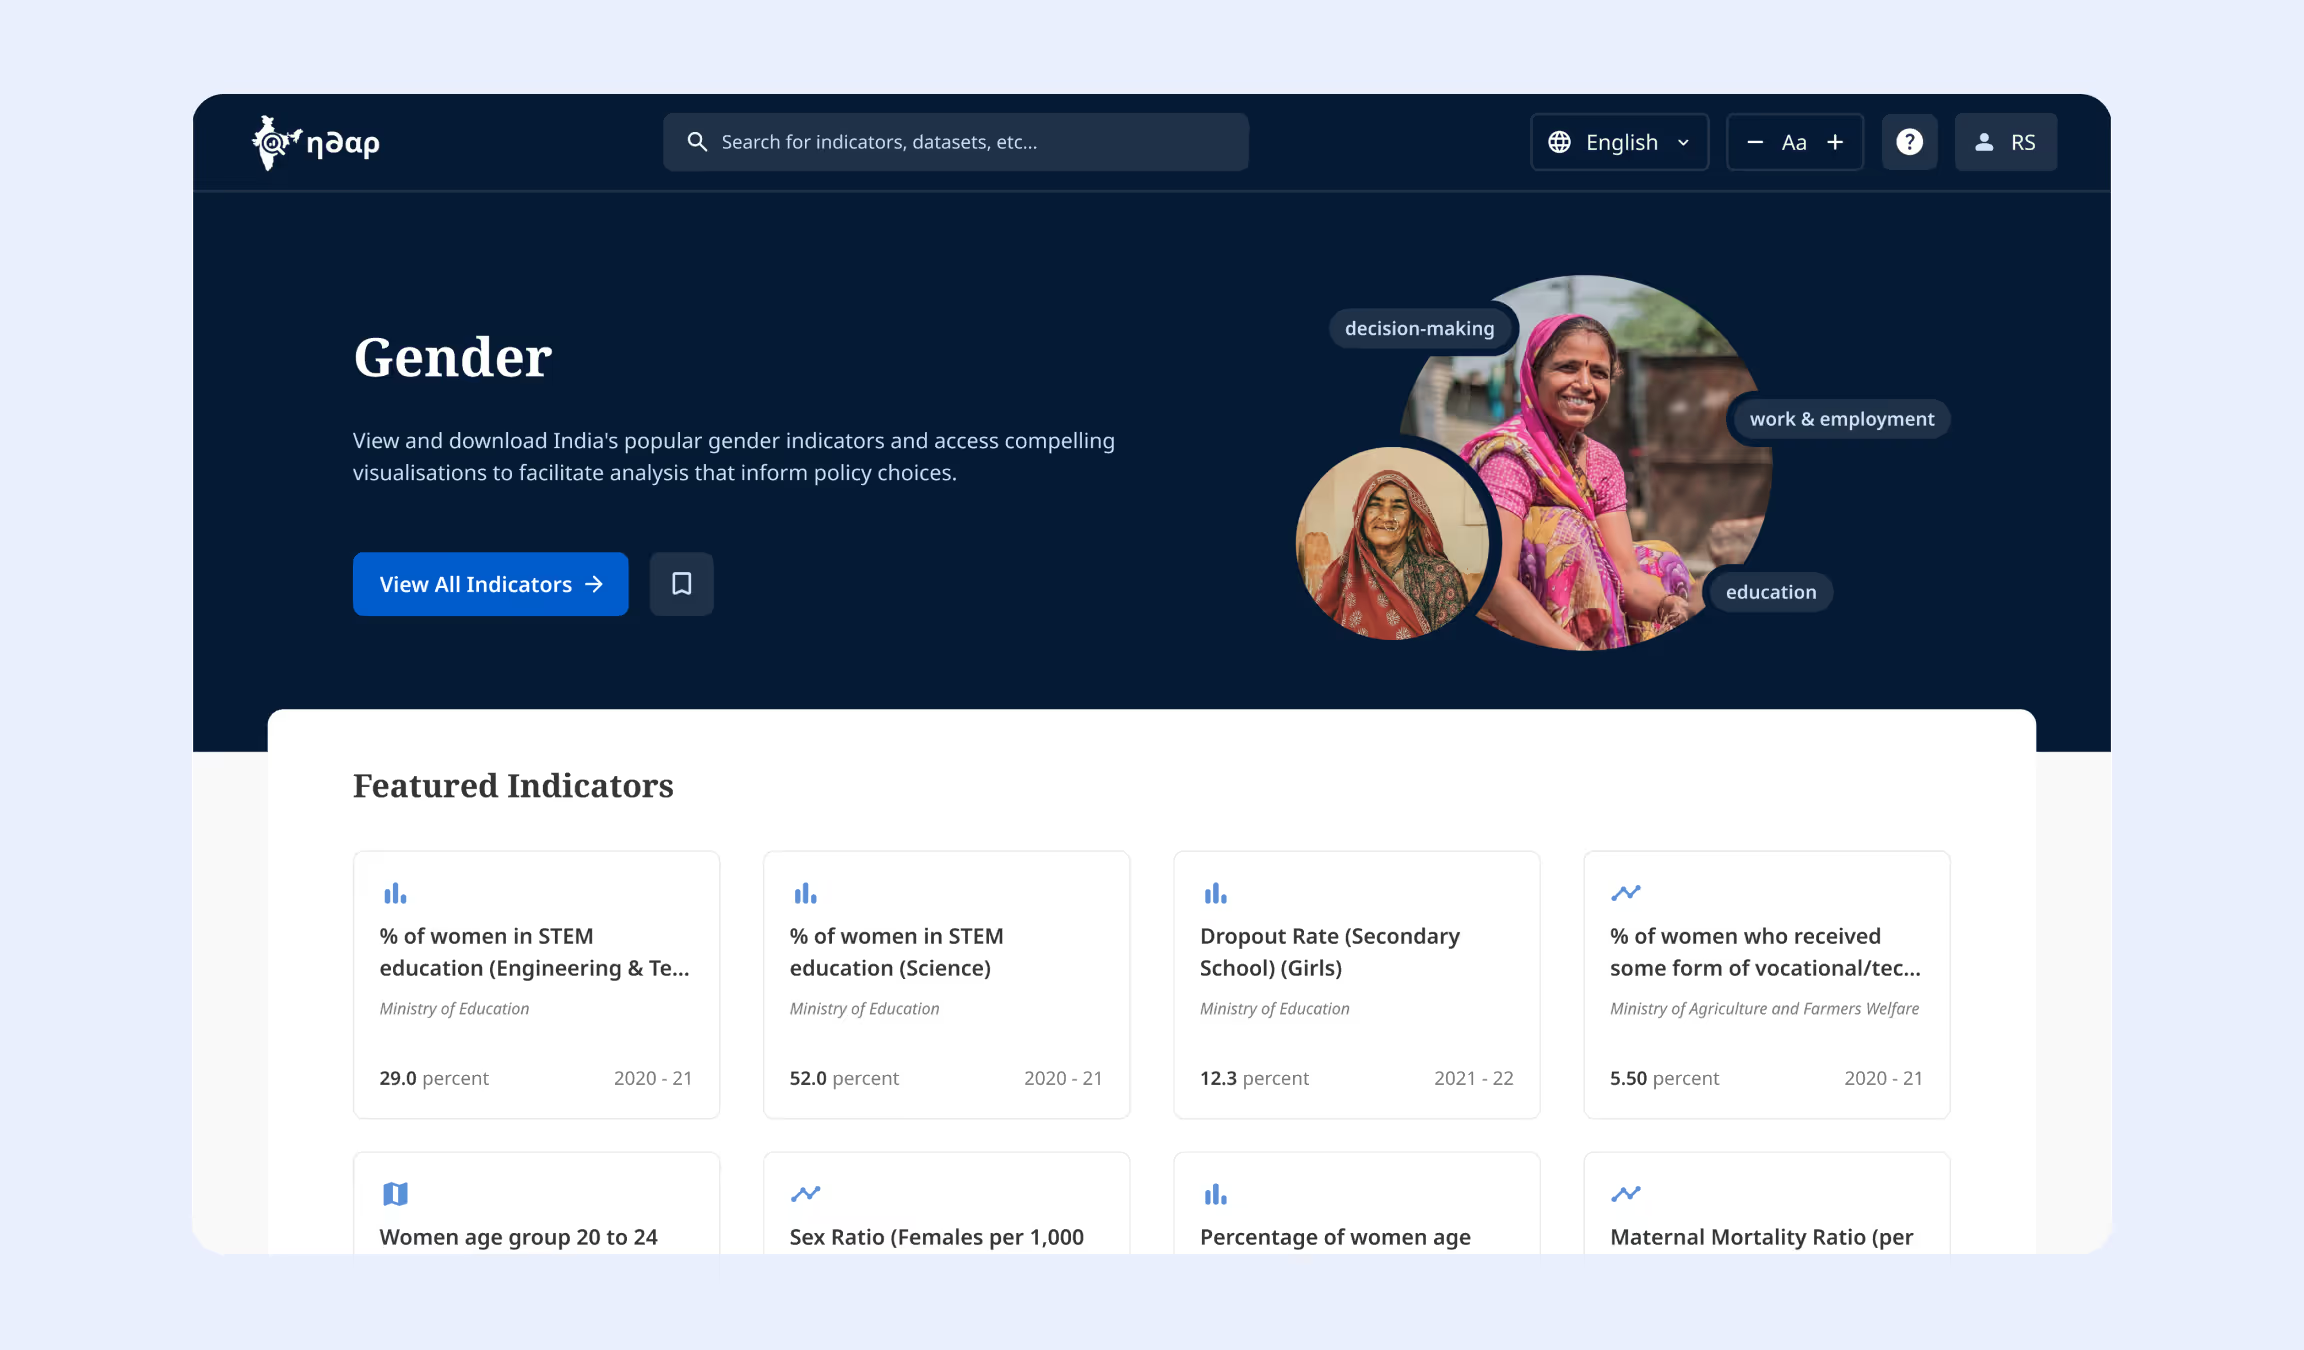
We made search results more scannable, using clear visual hierarchy and intuitive design. Icons introduced early in the journey built instant familiarity with key result types: Indicators, Datasets, and Collections. Highly popular indicators, grouped under themes (such as Gender, Work & Employment) were made easily accessible, with pre-made visualisations.
Making complex data tasks intuitive
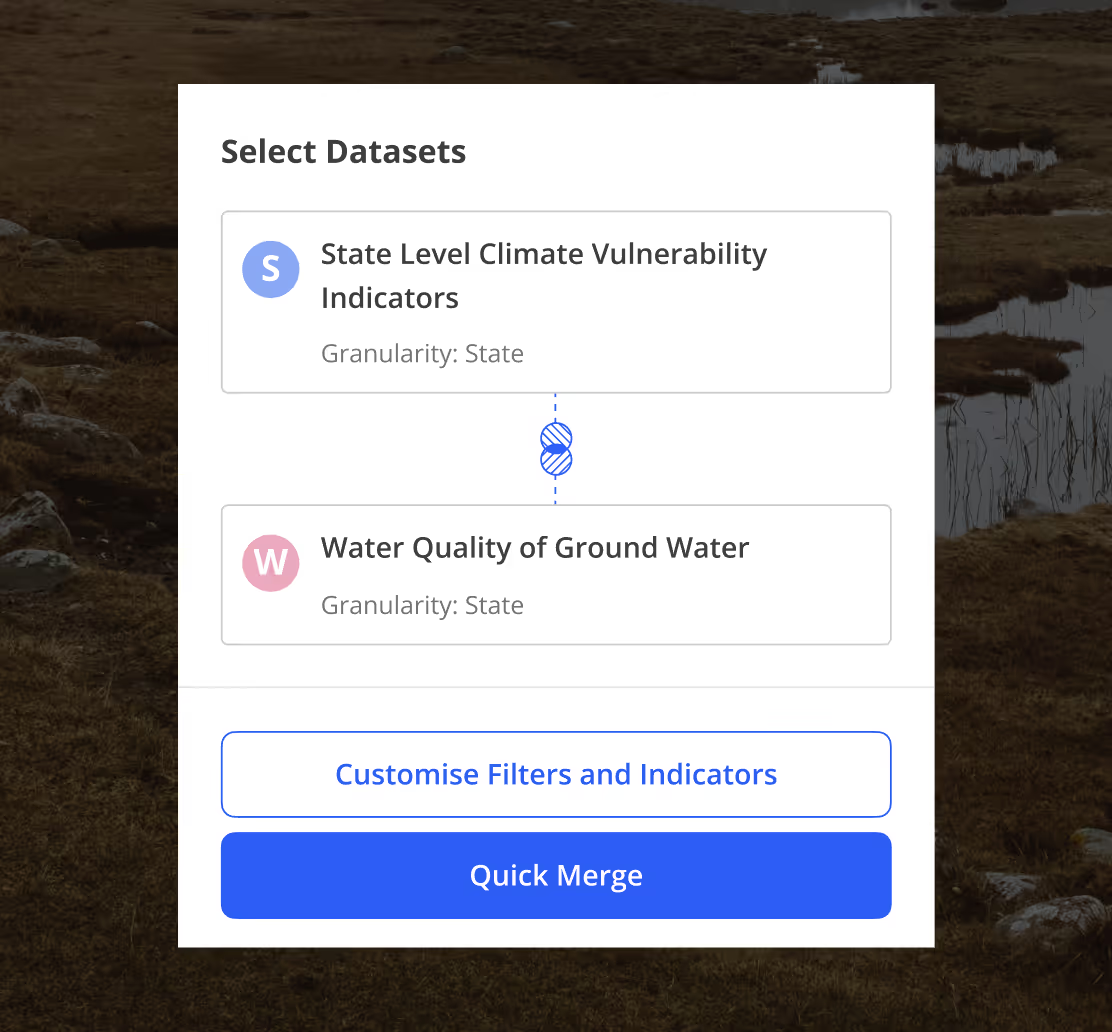
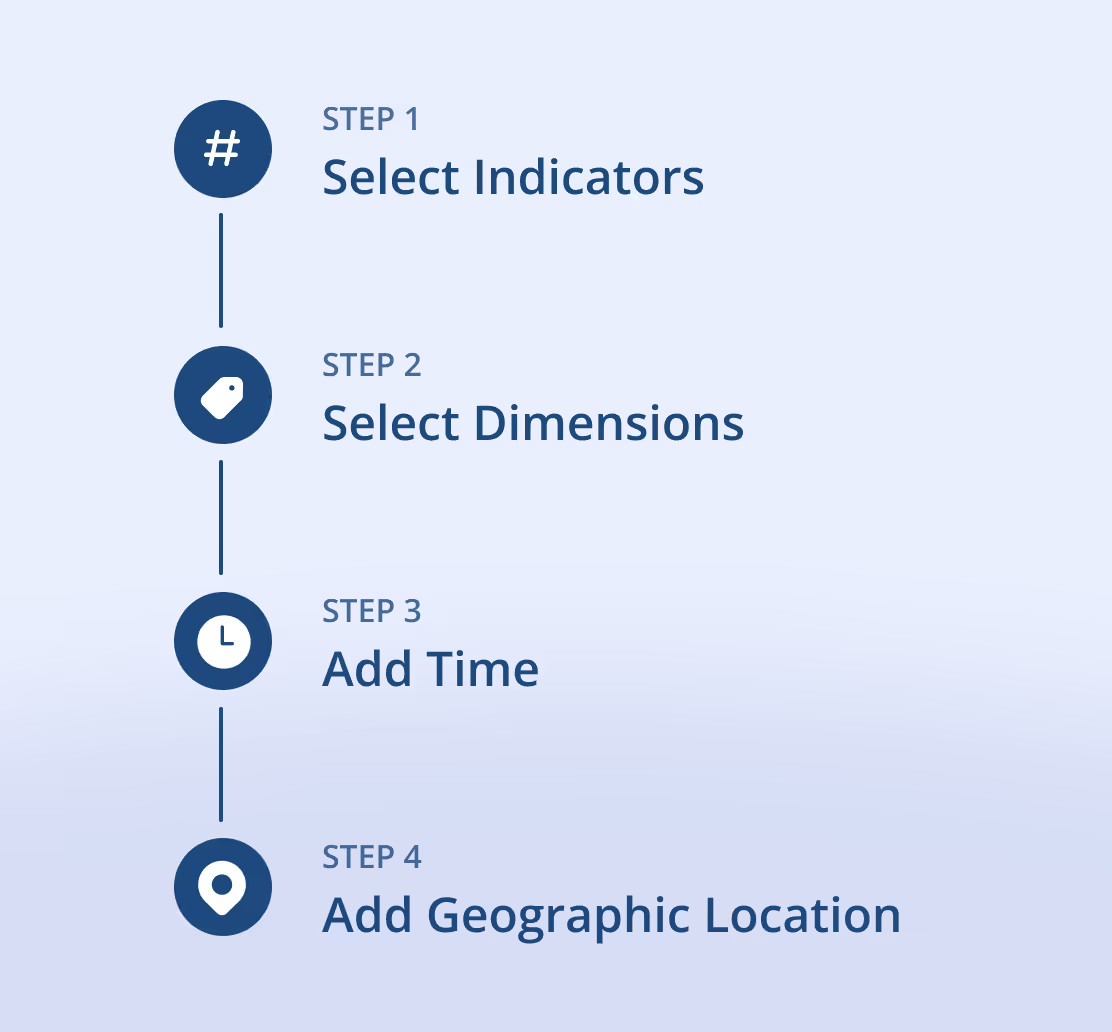
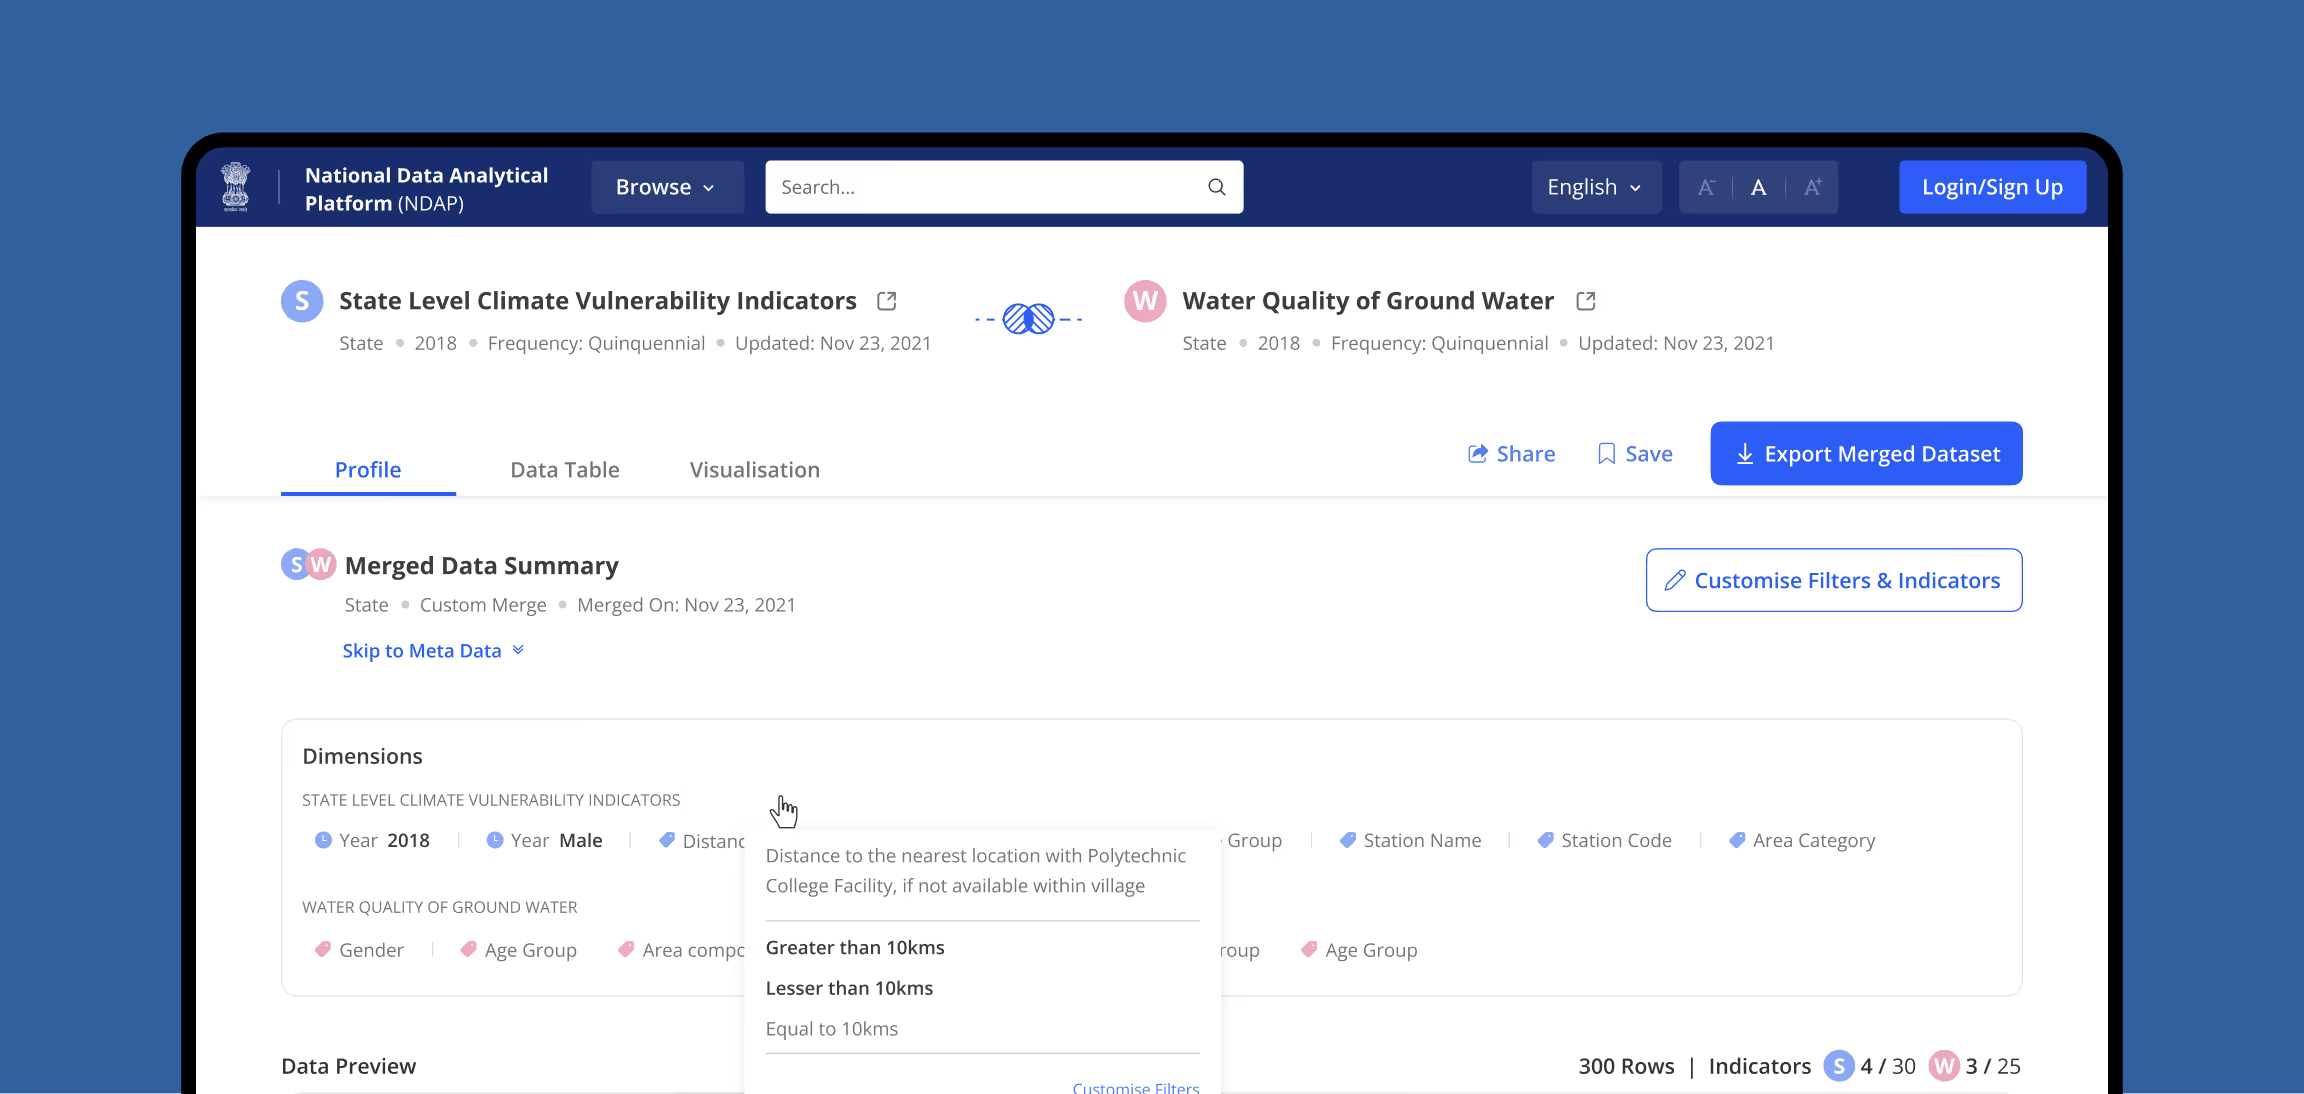
We made complex data tasks easy by prompting users when critical operations occur, and guiding them through clean, logical steps. Merging datasets became quicker and more accessible for users across all levels of data literacy, with a ‘Quick Merge’ option.
Guided visualisations for smarter analysis
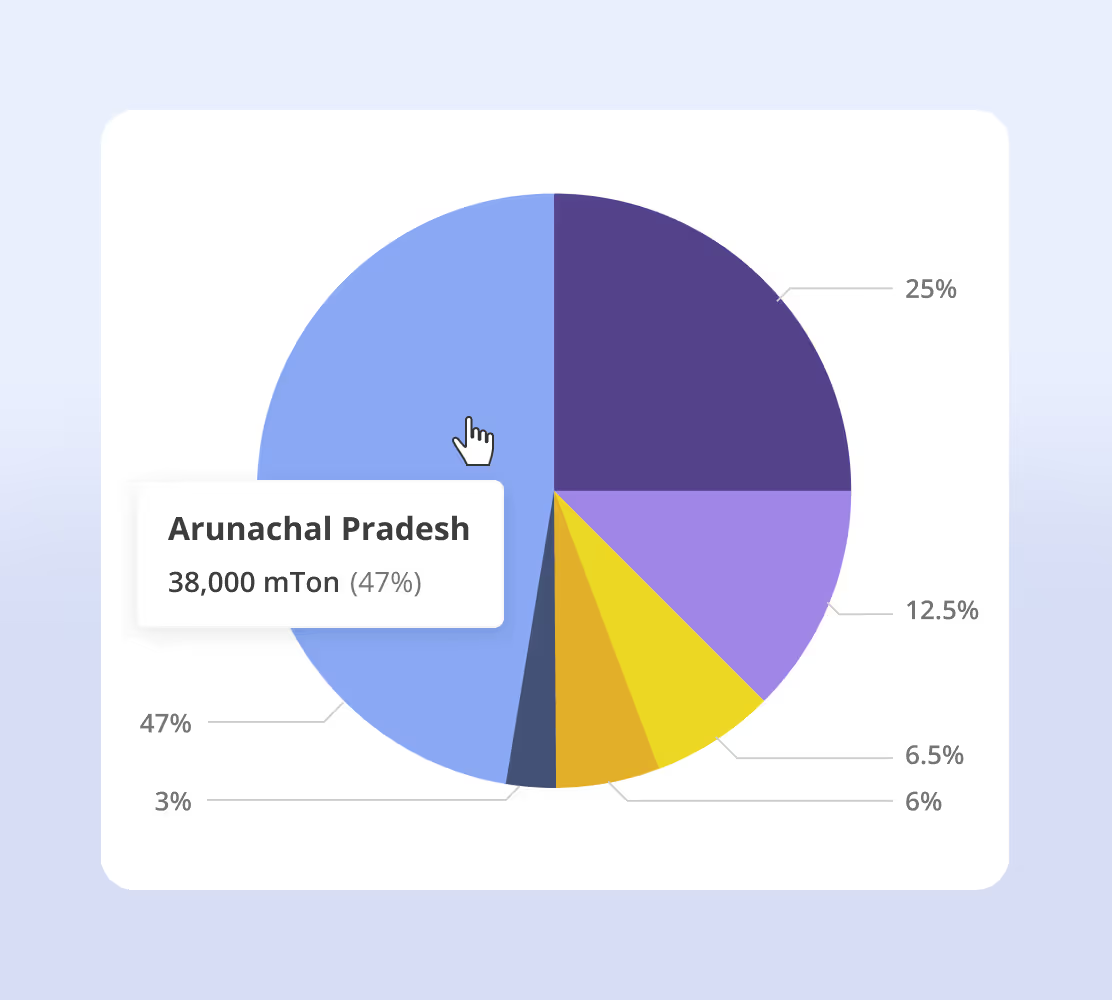
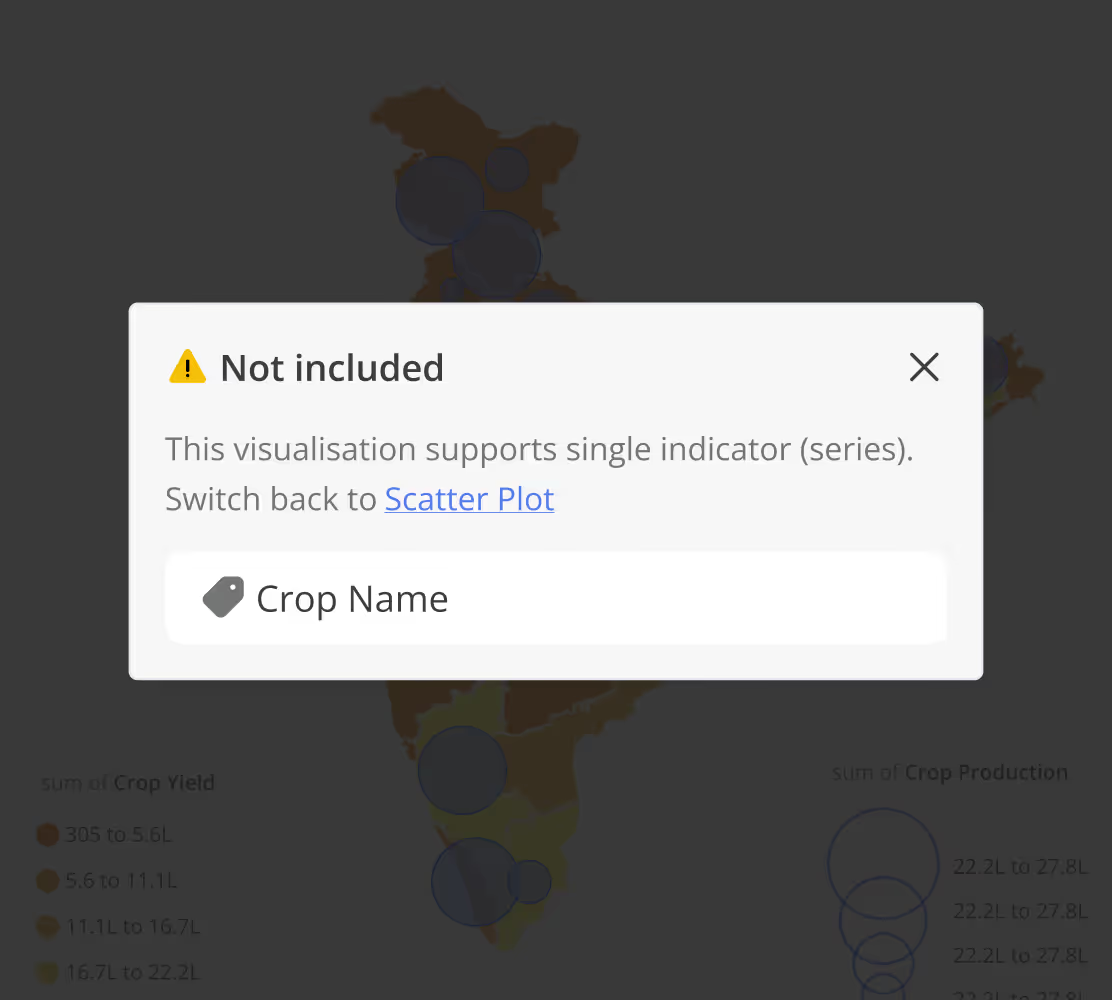
Visualisations allow us to harness the full potential of data. So we optimised for simplicity, clarity, and beginner-friendliness while designing the data visualisation flows. We effectively used nudges to guide the users towards the appropriate chart types and the best configuration options – such as the axes and indicators, and error messages while switching between chart types.